Supply risk
See which suppliers and plants sit in at-risk regions, the moment a hazard appears.


Geoverse puts every plant, supplier and shipment on one live, private map. Ask a question in plain English and watch the answer appear.
Geoverse puts the whole network on one map, so risk shows up where it sits.
Source: McKinsey Supply Chain Risk Survey, 2024TodayYour operation runs on spreadsheets.
The gapBut risk happens in places.
GeoverseEvery plant, supplier and shipment, on one live map.
Ask in plain English
The assistant plans the analysis, runs each step on your data and draws the result. You see every step, and every step can be undone. Try it below.
 Northfield Foods·NetworkLive
Interactive demo with sample data. Northfield Foods is a fictional company.
Time
Replay years of history month by month. See which plants and lanes carry the business, and exactly when that changed.
Northfield Foods·Throughput (3D)Model Builder
Chain tools into a model once. Geoverse saves it and reruns the whole chain as one job. Drag the steps around, then press Run.
Vector, raster, terrain, hydrology, LiDAR and network analysis run right in the browser, alongside spatial SQL on your own tables. Pick a family to see what it covers.
From continent to street
Flat maps, 3D buildings and terrain, a full globe, satellite and drone imagery, and 3D site scans, all in the same project. Hover the maps to look closer.
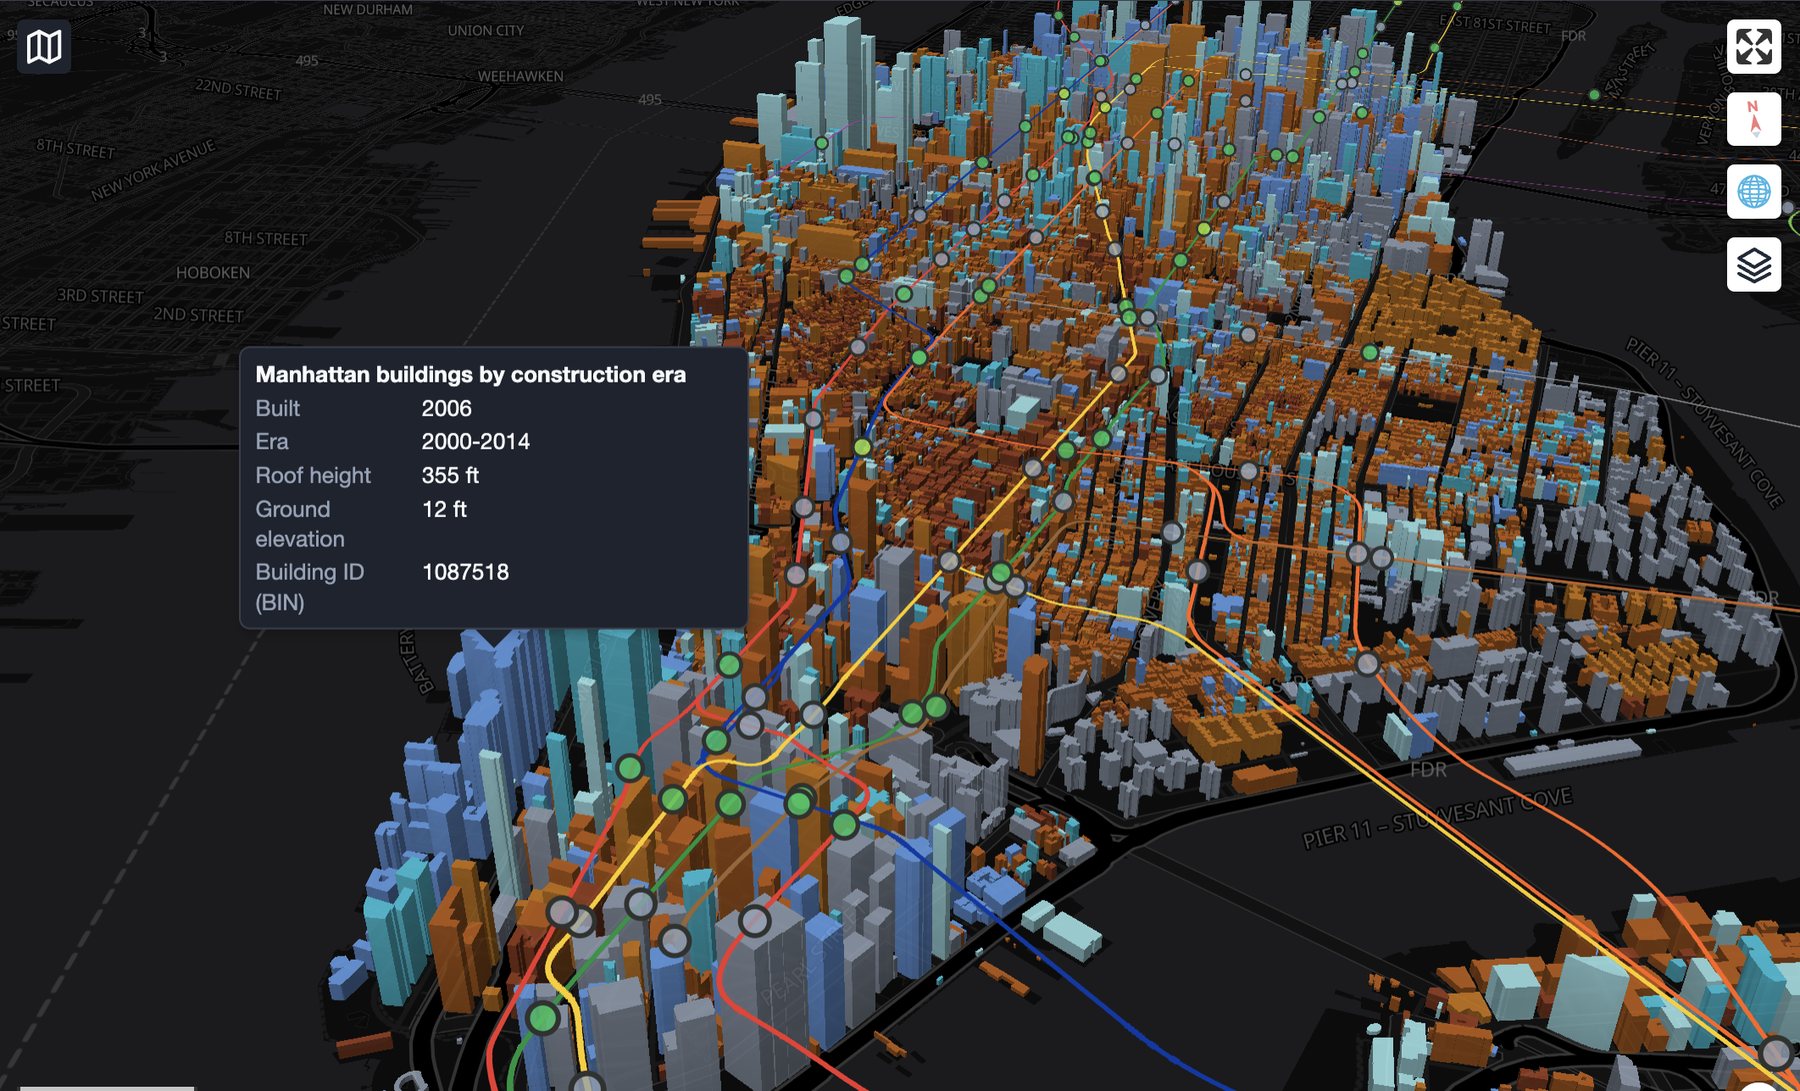
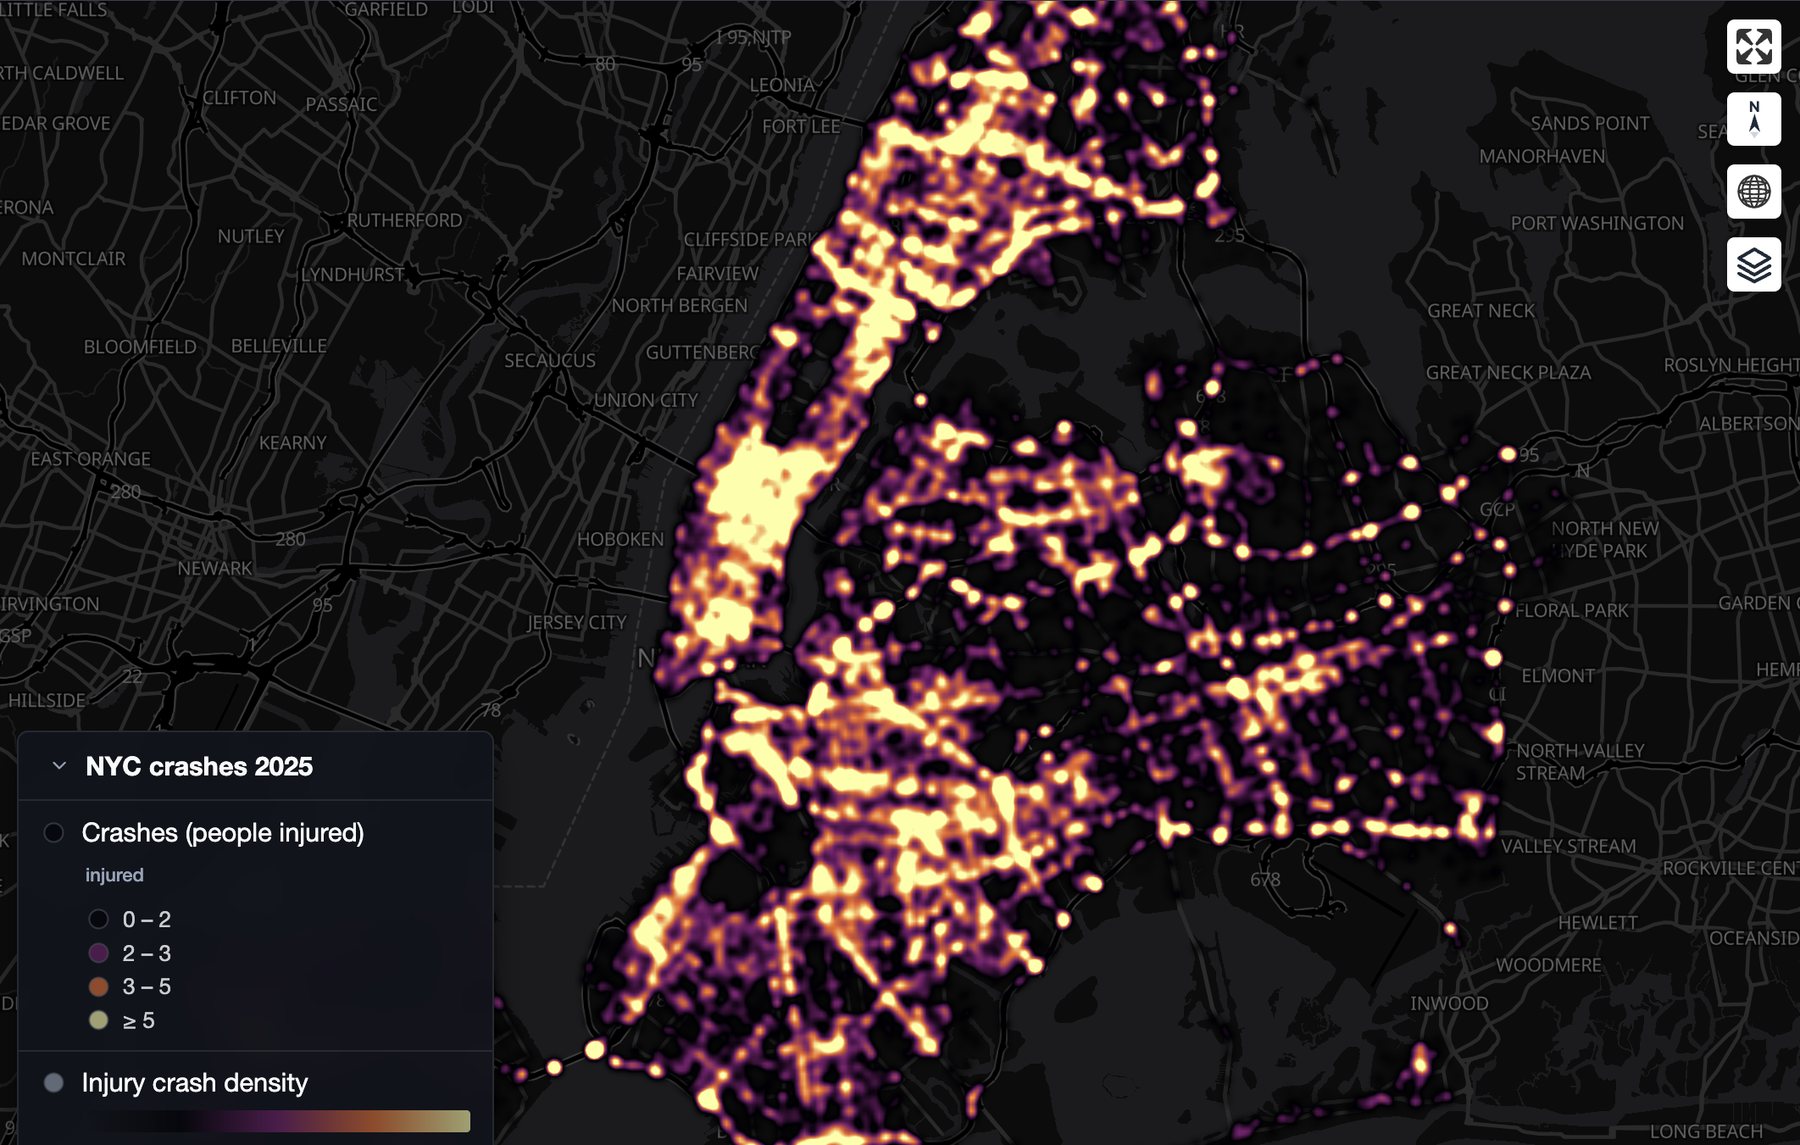
Screenshots of Geoverse rendering public New York City data.
Security
Geoverse runs on your servers. Your data, your maps and the AI that reads them stay inside your network.
Deploy on your own servers or private cloud, under your own access rules.
The assistant runs on private models with LoopLM, so no data leaves your network.
View, comment or edit access, expiring links and live co-editing.
Sits on top of your ERP and warehouse systems, plus live traffic and vessel feeds. Nobody changes how they work.
Use cases
Four questions operations teams ask every week, answered on the map instead of in a spreadsheet.
See which suppliers and plants sit in at-risk regions, the moment a hazard appears.
Spot which regions and distributors grow or slip, compared with the quarter before.
See where complaints cluster, by region and product, and which site they trace back to.
Trace delayed shipments back to the route or site where the delay starts.
The film
With sound and captions
Book a walkthrough with the Aether AI team. We will show Geoverse working on data like yours and talk through running it on your servers.